1 How Satellites and Aircraft Capture Data
In this chapter you’ll learn how satellites and planes take images.
What is remote sensing?
The motivation behind remote sensing: Directly measuring something on the ground can be tedious and time-consuming. Instead, we can also take a picture from afar and get information about land and water: We can learn about vegetation, wildfires, how many people live in an area, study the effects of disasters such as hurricanes. This is done by putting a “camera” onto an aircraft or satellite which then takes “pictures”. Or, to be more accurate, it’s sensors that collect data from electromagnetic waves that are reflected or emitted from the Earth or its atmosphere.
There’s so much to like about remote sensing:
- It allows us to monitor large areas easily.
- It allows us to observe inaccessible areas, even from the convenience of our homes.
- It allows repeated observations, so we can monitor changes over time.
- It has a global coverage, meaning we can compare different locations.
- It’s non-invasive, so you don’t have to disturb the wildlife.
Satellites versus aircraft
We can do remote sensing either with satellite or aircraft (airplane, balloon, drone). Technically, there is also ground-based and ship-based remote sensing, but we focus on taking pictures from above. Aircraft and satellite imagery differ in a few ways as described in Table 1.1.
| Aircraft Imagery | Satellite Imagery | |
|---|---|---|
| Spatial Resolution | High (e.g., 10–50 cm/pixel) | Medium to low (e.g., 10–30 m/pixel) |
| Temporal Coverage | On-demand | Regular (e.g., every 5–16 days) |
| Spatial Coverage | Small, local | Large-scale, global |
| Flight altitude | ~100m to a few km | ~500-1000km |
| Best For | Detailed, localized analysis | Broad, repeatable monitoring |
Aircraft and satellite remote sensing have different use cases. If you need to identify individual trees in a German nature reserve, you might need to pay for an aircraft to fly over the area (although it may be possible with a high resolution satellite imagery). But if you want to monitor large parts of Amazonian rain forest over the years, satellite data is much better suitable and cheaper, often even free.
This book focuses more on satellite imagery, but we will cover aircraft as well.
How sensors capture images
The aircraft and satellites carry sensors with which they observe the Earth. You can think of these sensors as a camera pointing towards Earth and taking a continuous image.
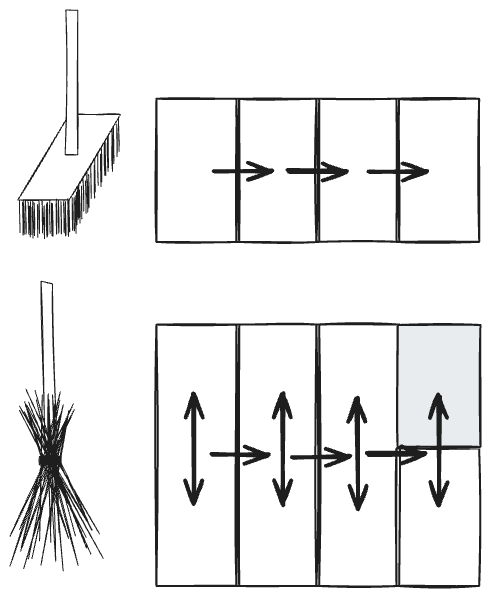
The sensors can be fixed or they may move from side to side with the help of a rotating mirror. Since the satellite or aircraft itself is also typically moving forward, the sensors basically “sweep” over the ground. We can visualize these two movement patterns as “brushes”, see Figure 1.1. There’s the pushbroom approach which moves in one direction and which is typical for many modern sensors as in the Sentinel-2 satellites. And there’s the whiskbroom approach, which additionally sweeps from side to side, a typical approach in older systems as used in Landsat 7.
In addition, there are satellites with a geostationary orbit, like, for example, Meteosat-11. These fly extremely high at an altitude of ~36,000 km. Geostationary means that the satellite matches the Earths rotation and therefore stays at a fixed position in the sky. Meteosat-11 is used for weather monitoring and has a high frequency of data, e.g. every 5 to 15 minutes and has a resolution of 1km for visible channels and 3km for infrared channels.
Satellites and aircraft sensors are characterized by their”swath”, which is the width of the images. For example, the MODIS sensor has a swath of 2330km. Whiskbroom sensors often achieve wide swaths thanks to their mechanical scanning. The ground sampling distance (GSD) tells us how large an area on the ground is that is represented by a pixel in the image.
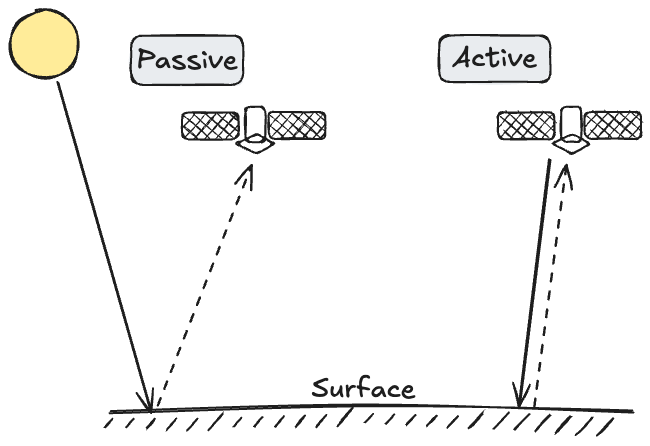
The sensors can be either active or passive depending on whether they use a passive or active energy-source. It’s very similar to your phone’s camera: Let’s say you are at the beach and take a photo of the sand castle you just build. This is an example of a passive energy source, since your camera collects the sun’s light that is reflected from the sand castle. Later, after dark, you take your dog for a walk. You photograph the castle – now unfortunately destroyed – again. Since it’s dark, you turn on the flash light. Now you’ve used an active sensing method because you provided the energy source and captured the returning light again with the camera sensor. To summarize: Passive sensing relies on using an already existing energy source like sunlight or Earth-emitted radiation, while active sensing means providing your own energy, see also Figure 1.2.
Not all satellites take images as your camera would, but actually capture a part of the electromagnetic spectrum which may or may not be light that is visible to the human eye. Time to go a bit deeper into the physics of the electromagnetic spectrum.
The electromagnetic spectrum
Everything we see with our human eyes is just the visible light, which is an excerpt from a larger spectrum of electromagnetic waves, see Figure 1.3. While sensors, like our phone camera, might capture this visible light, other sensors may collect information from other parts of the spectrum. A fire, for example, emits infrared light, which is what we feel as warmth on our faces when sitting around a campfire but which we can’t see. There’s an entire range of electromagnetic world around us which is invisible to your eyes. I’m talking radio waves, ultraviolet waves, x-rays, infrared and much more.
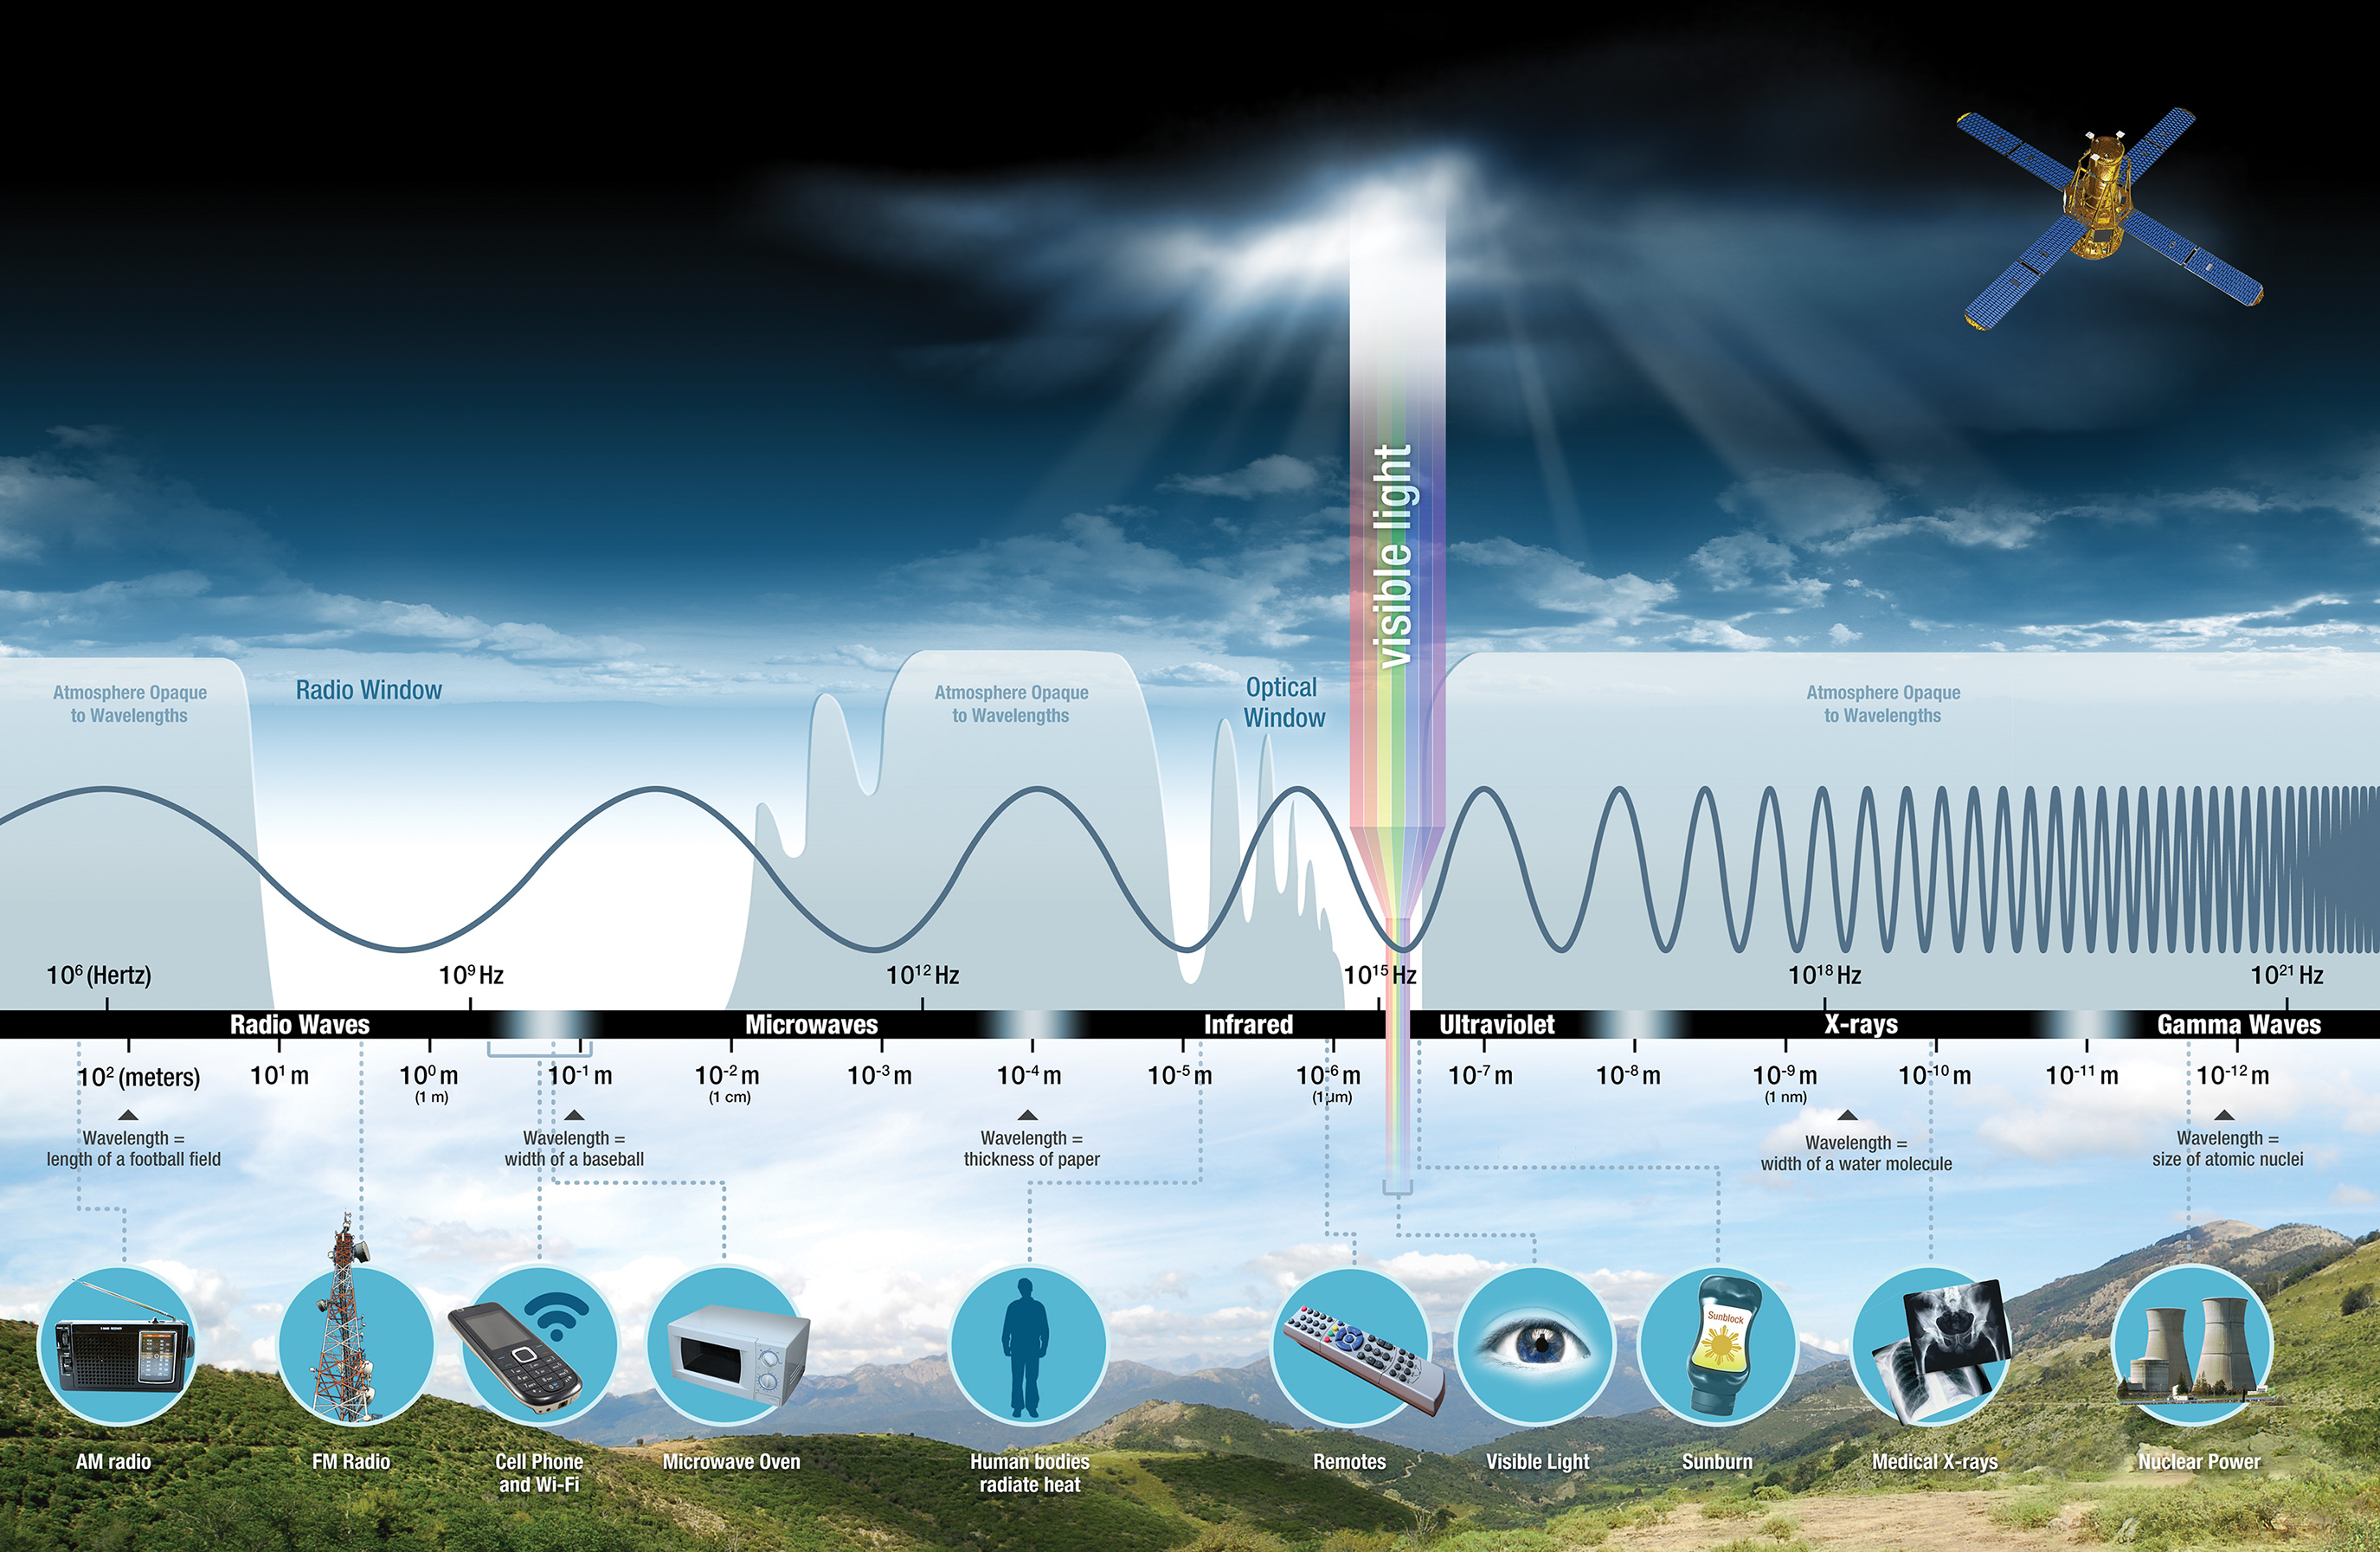
We can characterize these electromagnetic waves by their wavelength. And we need different sensors to capture different wavelengths:
- Optical sensors typically record visible light (400–700 nm) or near-visible light such as near-infrared (700–1000 nm).
- Thermal infrared sensors record thermal radiation in the mid- to long-wave infrared range (3–15 µm). This is super useful for collecting information about heat: detecting wildfires, monitoring the temperature of the oceans and of the land, and so on.
- Shortwave infrared sensors (SWIR) operate in the 1000–2500 nm range and are useful for detecting moisture content, differentiating snow and clouds, and monitoring fires.
- Microwave sensors operate in the microwave part of the spectrum (1 mm – 1 m*). These include:
- Active microwave sensors, such as SAR (synthetic aperture radar), which emit microwave pulses and measure the return signal. Useful for detecting surface roughness, structure, and movement, and for imaging through clouds or at night.
- Passive microwave sensors, such as radiometers, which measure naturally emitted microwave radiation. Useful for estimating soil moisture, sea surface temperature, ice thickness, and water vapor.
- Lidar sensors shoot out laser pulses, either in green (~532 nm) or infrared (~1064 nm) light, and record the time it takes the light to return. This allows Lidar to create an elevation profile of the surface. Can be mounted on either aircraft or satellite.
Not all of the electromagnetic spectrum can travel through the atmosphere, as visualized as well in Figure 1.3. That’s because of molecules in the atmosphere through which certain wave lengths can’t travel.
Cutting the spectrum into bands
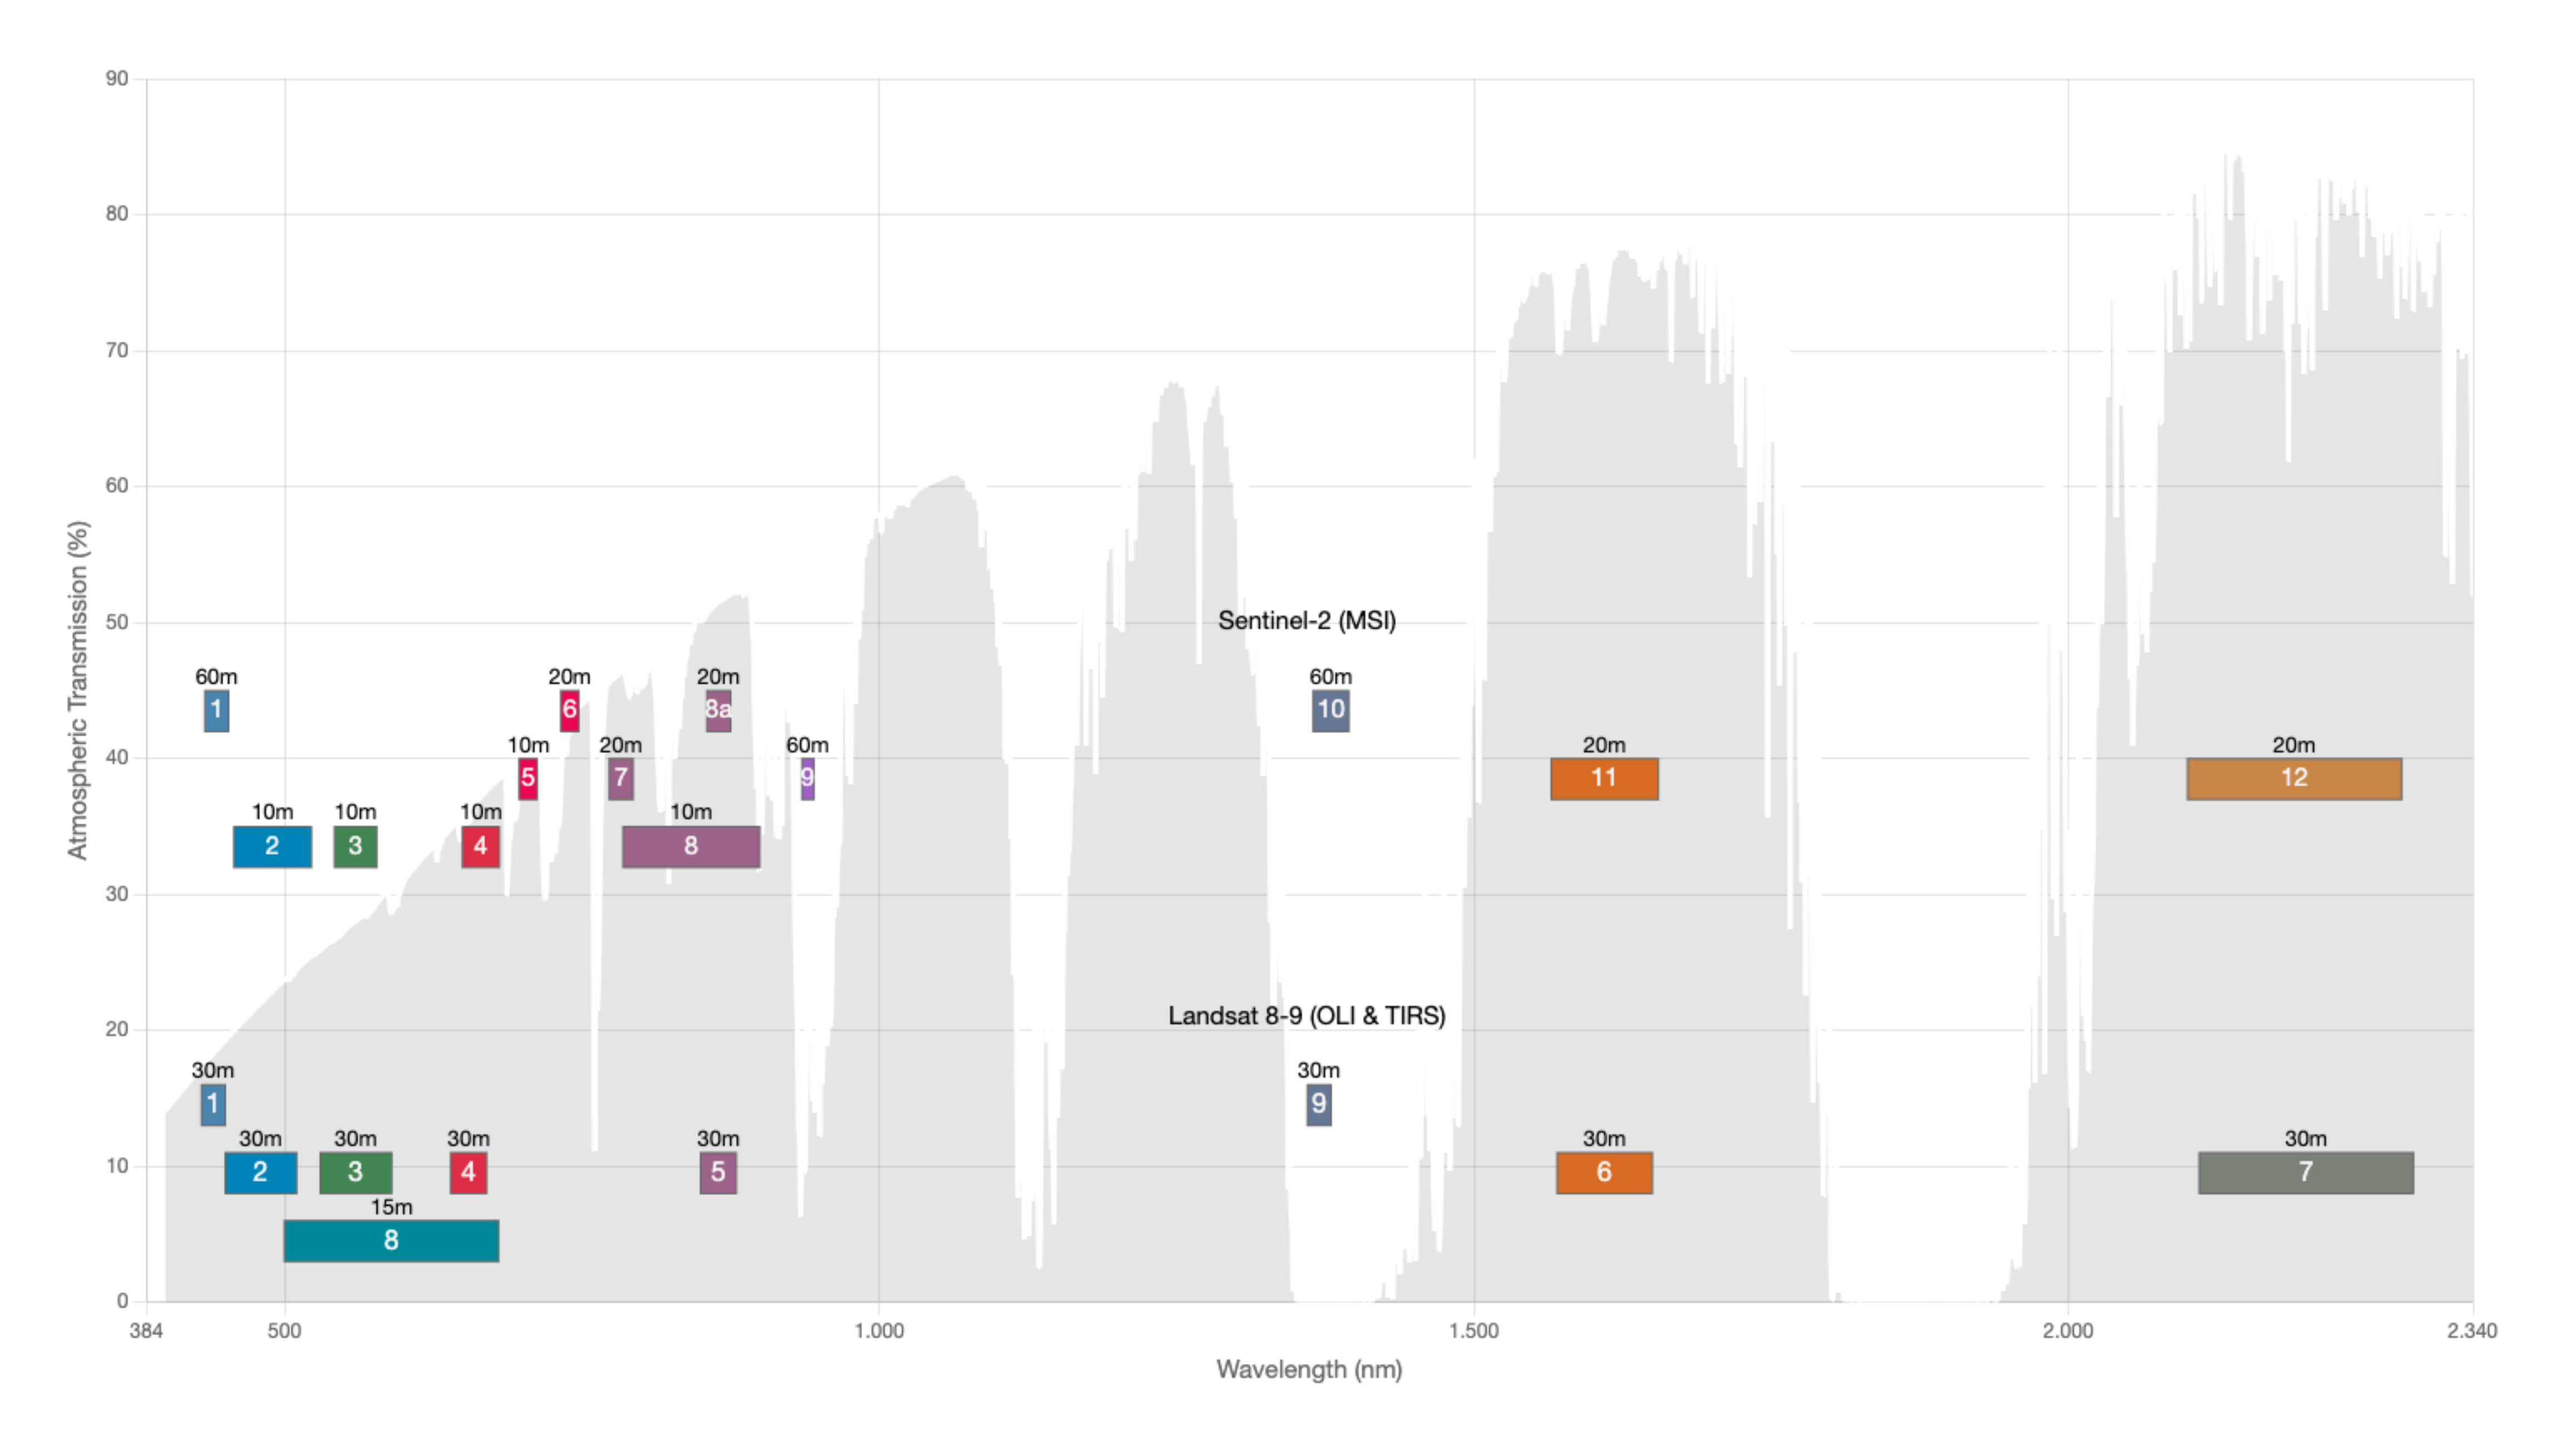
When you take a photo the phone doesn’t store the entire information of the visible light. Instead, it typically stores three compressed summaries of that information: the red content, the green content and the blue content, short RGB. The reason: We have to digitize the continuous light spectrum. So instead of storing a continuous spectrum of the visible light (which we could anyways only approximate since we work with digital devices), we compartmentalize it. Red, for example, corresponds to a narrow spectrum of the visible light, and we basically measure how much energy was in that short “band” that we call red. Same goes for green and blue. This gives us an image to store. By re-mixing the colors, we get an approximation of the image again. It should get much clearer with the visualization in Figure 1.4, which I created with this NASA website.
While people often call them “Bands”,at least for satellites like Landsat and Sentinel, they may also be called “Channel” (e.g., MODIS), or “Spectral Band”. Band is typically used for optical and multispectral data and channel for microwave, thermal or radar.
Wait, looking at Figure 1.4, why is band 10 of sentinel-2 and band 9 of Landsat 9-8 in area without atmospheric transmission, meaning the atmosphere blocks all the waves? Because this band is not used for observing the ground, but for detecting water vapor in the atmosphere – for detecting cirrus clouds that can reach a high altitude.
Multi-spectral and hyper-spectral sensors collect data for a wider range of the electromagnetic spectrum. Multi-spectral means having 10-ish bands while hyper-spectral goes into the hundreds of bands. An example is EnMAP, a German satellite for environmental monitoring with 230 (!) bands from 420 - 2450 nm wavelengths.